(You can download the entire article in a nicely formatted pdf doc from the above embedded file. The WordPress format has changed for the worse and I am going to update the long-form article over a couple of days. Figures are missing from the article below and will be added over the next few days.)
In recent years there has been an upsurge in awareness of how the British looted Bharat. One of the most popular statistics is that Britian stole $45 trillion from Bharat. This statistic rose to prominence with the Indian External Affairs minister Dr. Jaishankar’s statement in Washington DC in 2019 (ThePrint 2019). Scratching the surface, we find that this figure was first proposed by Prof. Usha Patnaik (Chakrabarti and Patnaik 2017) and is based on the financial chicanery that the British employed to suck money out of India to fund their industrial revolution and wars for close to 200 years.
This figure is an excellent start to compute the drain of wealth from Bharat but is incomplete as it does not include the earnings lost by Indians due to forced labor, loot of Indian cities and kingdoms after each war, use of up to a million women as sex slaves in army camps and public brothels, and the revenue extortion from farmers for 180 years.
Coming back to the point, one of the key contributors to the $45 trillion was the land revenue (i.e., land tax) extorted from Bharatiya farmers. In this monograph, I have selected Tirunelveli district in Tamil Nadu to demonstrate the kind of loot the British carried out and its terrible consequence on Indian farmers. The loot from Tirunelveli makes up a small portion of $45 trillion drained from Bharat by the British.
Kailasavasi Dharampal had collected revenue data for 150 years for Tirunelveli district from different British era sources (Dharampal 2011), the chief of which was the “Manual of the Tinnevelly District” published in 1879 (Stuart 1879). This Manual has the revenue data till 1879; after this year Dharampal used different settlement reports to complete the data series till 1947 CE.
However, in Dharampal’s data there is a gap of 20-30 years which I have tried to plug using sources which are available online (thanks to the internet revolution!). The chief of these sources is the “Reports on the Settlement of Land Revenue in the District of Madras Presidency” for various years and the report on agriculture statistics published by the Government of Madras (Statistics 1963).
Note on the articles structure: I have given a brief overview of the history and geography of Tirunelveli district at the beginning of this article. I have kept the background sections short as the main purpose is to illustrate the devastating effects of the British revenue extortion. If you are interested in learning in-depth about the history of Tirunelveli district, I would encourage you to refer to books such as the Gazetteers which give detailed information on this topic. I have not made the distinction between the English East India Company (EEIC) and the British Crown, as this is simply semantics. Due to force of habit, I have used the terms Bharat and India interchangeably in the article.
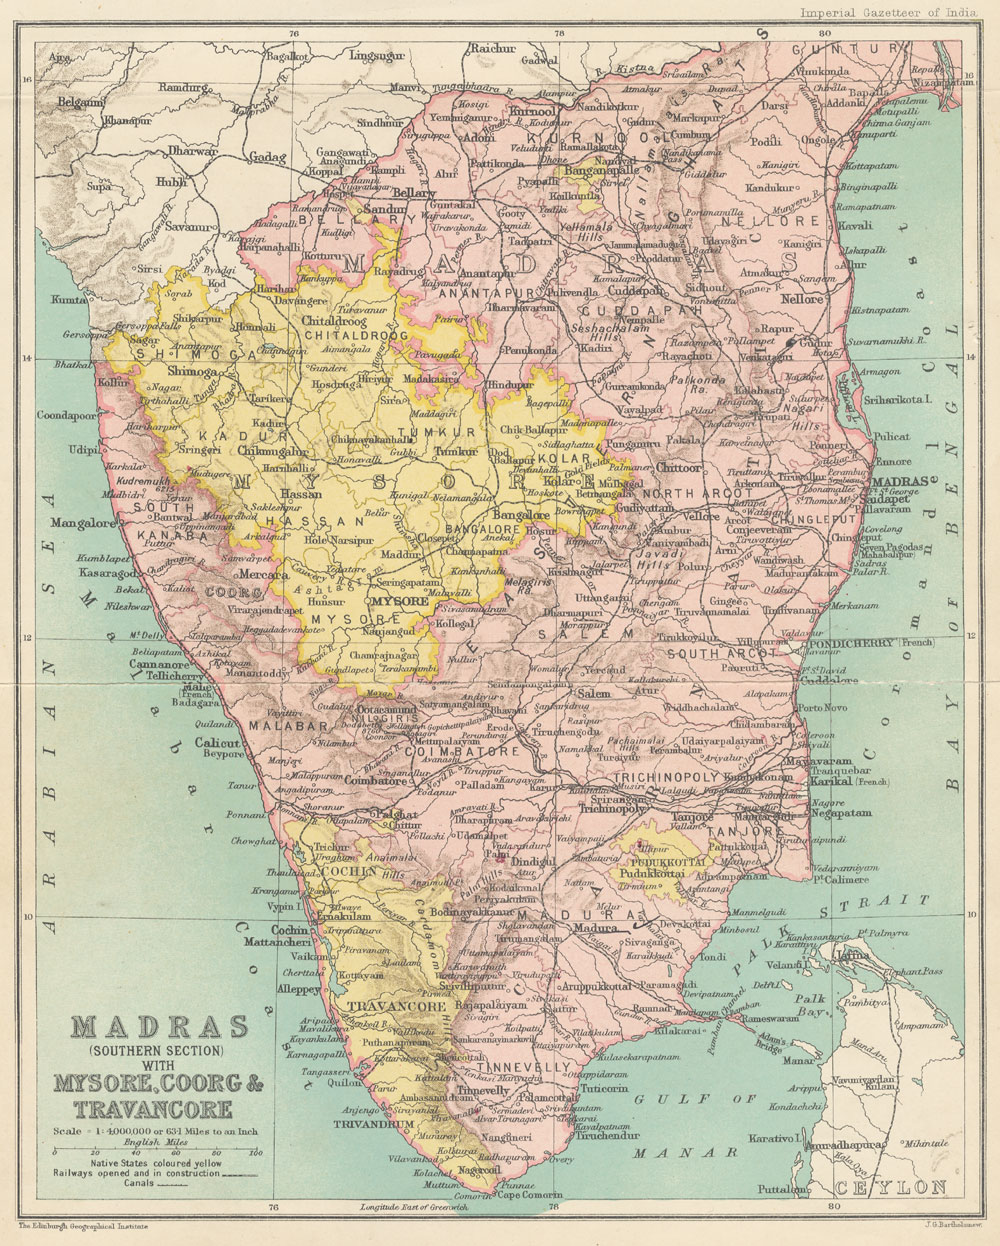
Figure 1 Map of Madras Presidency circa 1909 with Tirunelveli (Tinnevelly) district at the bottom right
The map in Figure 1 shows the size of the district in 1909, when it was known as Tinnevelly. The district has gone through many divisions in the last 200 years and its current size is roughly half of its 19th century version. Present day Tirunelveli district is in the shape of a wedge and is bounded by Kanyakumari on its left, Thoothukudi on its right, and Tenkasi on its head.
Tirunelveli is unique geographically in the sense that it bounded by the Bay of Bengal on its Eastern side, by the Western Ghats on its western side. This gives a good variety in terrain with forests, barren land, and saline sand deserts on its coastal periphery.
The Western Ghats are 1000 to 3500 feet high and covered with a variety of evergreen forest (Statistics 1963). The Tambraparni is the key river which flows through the district for around 185 kilometers before joining the ocean. There are several dams (called anicuts) across the Tambraparni and several streams from the Western Ghats (Statistics 1963). The soil along the river plains is rich black soil, whereas the coastal belt is sand and covered with palm trees.
For a greater part of the last 650 years, Tirunelveli was a part of the Vijayanagar empire. From 1600’s onwards, with the weakening of the Vijayanagar empire, their military commanders the Nayakas of Madura, became de-facto rulers. They were great rulers and warriors and kept the administration and revenue system going as per tradition.
With the 1700’s there was a weakening of authority and in 1736 a Muslim mercenary, Chanda Sahib (son-in-law of the so-called Nawab of Arcot), deposed the last Nayaka Queen Meenakshi by deceit and took over the district. But the local Hindu chieftains known as Palaiyakkarars in Tamil and Palegaru in Telugu (corrupted to Poligars by the English) gave the Muslim despot a hard time in revenue collection.
From 1750’s onwards it was the English who called the shots as far as revenue collection was concerned. As the Nawab of Arcot increasingly went into their debt, they gradually took over the revenue collection. Thus, out of the 26 administrators deputed by the Nawab from 1739 to 1800, the last two were Europeans. This tyranny was ferociously resisted by the Palaiyakkarars, such as the great Veerapandiya Kattabomman, till the East India Company destroyed them after a hard campaign around 1801. The last great Palegaru who fought against the British was Uyyalawada Narasimha Reddy from Andhra Pradesh who led a small army in the 1840’s and was finally hanged in 1847 by the British.
Before 1801 CE, a major part of the district was ruled by Palegars. They were the bulwark of resistance against the Nawab and the British atrocities and prevented the farmers from being bled to the bone by the British. It is no surprise that the British lovingly referred to them as “free-booters” and “desperate marauders” who extorted money from the people (Stuart 1879). It is pertinent to note that the Marathas was also derided as freebooters and the Maratha Admiral (Sarnaubat) Kanhoji Angre was labeled a pirate by the British. The palegars were essentially local kings who had their own estates known as palaiyams and also looked after a certain number of villages. They ran an independent administration with taxes, land revenue, and local police known as desakaval. Later British revenue officers lamented that the Palegars usurped large amounts of revenue from the sirkar (government) villages (H.R. Pate 1917). Extortion of course was the British right!
Till 1792 CE, the Nawab had nominal control over the district and appointed revenue officers known to the British as “Renters”. This was a strange breed which was despised by the people and was responsible for collecting the revenue from the sirkar villages while the palegars were responsible for revenue collections from their palaiyams. From 1799 to 1805 the British formally took over the region. In 1799, after a fierce battle, the British murdered the palegar of Panajalankurichi and began dismantling the indigenous military and civilian infrastructure. The estates of six palegars of Panjalankurichi, Kulattur, Kadalgudi, Elayirampannai, Kolarpatti and Nagalapuram were split-up and large parts distributed to loyal collaborators as bakshish. This led to the consolidation of a lot of land in two or three palegars who were later styled as Zamindars of Ettaiyapuram, Maniyachi, and Melmandai by the British.
The smug pompous attitude of the British is reflected in the comment by Lushington in 1800, where he says that:
“ The nature of the permanent settlement and of the system of law and security by which it is to be enjoyed by themselves and handed down to their posterity has been repeatedly explained to the poligars; and they now wait with anxious solicitude the confirmation of a blessing which is to soften them to the remembrance of former sacrifices.” (H.R. Pate 1917)
From 1805, began a long and terrible time for the district as the British devastated the district with their rapaciousness.
The district gets rain twice every year: a) During the North-East monsoon from October to December; and b) The South-East monsoon from June to September. It is the North-East monsoon which is the main one in terms of rainfall. The average annual rainfall till 1955 was around 1244mm ( 49 inches) (Statistics 1963), whereas the data from 1970 to 2015 shows a marked decrease to around 752 mm (29 inches) (P Arumugam 2016). The coastal districts get more rain than the inland areas.
The one fact you should understand about the pre-British land revenue especially under Hindu rulers was that it was collected in kind not in cash. The farmers handed over to the rulers a part of their produce, this part could vary from 10% to 30% of what they reaped in a year. If the rains failed or drought struck, the amount they handed over went down proportionate to the harvest. Another aspect was that the rulers were flexible in their demand and if the conditions were unfavorable for farmers the demand was reduced. Prior to 1739, Tirunelveli was under indigenous Hindu rulers and the prosperous state of things is illustrated by this comment from A.J Stuart, who compiled the 1879 manual for Tirunelveli district:
“All we know is that its last four centuries produced the temples and the irrigation works of Tinnevelly. A Government whose wealth and whose tastes are manifested by the temples and statues of Tinnevelly, and whose readiness to employ all its resources for the benefit of its people, as proved by the number and nature of the irrigation works which it completed, implies a contented and prosperous people ; while a high state of the arts and of knowledge is abundantly testified by the exquisite design and workmanship discoverable in many of the temples and Statues, as well as by the grasp and mastery of the principles of irrigation, a complicated and difficult branch of the engineering are displayed in their irrigation system.” (Stuart 1879)
The system of land rights had been in existence for thousands of years and involved a complicated arrangement where the land rights were distributed between the village, individual farmers, tradesmen (barber, blacksmith, weavers etc.), and entire jatis (not castes!) engaged in a specific occupation (Mustafa 2007). The beauty of the system was that the non-agricultural classes such as the village chowkidars had a share in the harvest, thus ensuring their survival even in hard times. Land was regarded as a hereditary possession, and it was a rare occurrence for someone to be dispossessed of their land for non-payment of dues. Even the Raja did not have sole rights over the land, while he could demand tribute and revenues in kind, he did not have the right to kick-out the farmers. Land had no sale value even till the mid-19th century.
Another interesting aspect of the pre-British administration in villages was the Kaval system. This was the Bharatiya system of law enforcement in rural Tamil Nadu and came about during the rule of the Vijayanagar empire. This system functioned by dividing policing duties into different aspects such as protection of crops, people, animals, and property. This system was financed by taxes collected for each aspect. Thus, Desakaval was a tax to employ an armed force to protect a group of villages, sthala kaval was the tax to protect a particular village and so on. The local police or Kavalkarars were the support system for the Palegars as well. Thus, when the English destroyed the Palegars, they took active steps to tranquilize the Kavalkarars. This led to a prolonged struggle which ended with the Kavalkarars becoming criminals and classed as by the British in 1917 as a “criminal tribe”.
While the British destroyed the Palegers by 1801 CE, they did not stop collecting the desakaval fees and also took over the revenues from all sources such as land revenue, the salt, sayar (a type of sugar/gur), and abkari (alcohol).
Troubled times started when the region went under the Nawab of Arcot, who made himself ruler by deceiving the last of the Nayaka rulers of Madurai. The Renters appointed by the Nawab were responsible for collecting the revenue from the Palegars and villages which did not come under Paleger rule. There were 26 renters in the 62 years rule of the Nawab. The prominent characteristics of the renters were (H.R. Pate 1917):
Extorted over 80% of the produce from farmers by dubious means including torture.
Forced farmers to repair tanks, canals, river embankments etc. for free.
Everything that the farmer owned could be usurped by the renter including his house, cattle etc.
If the farmer reaped the harvest without the renter’s permission, an army of peons would beat the daylights out of him and confiscate his meagre share.
The Sirkar or the ruler had the first right to sell their share, this was done to get the maximum market price. The farmer could not sell till the Sirkar had sold their share.
If he wanted to sell at the district markets, which was quite a task before automobiles came along, he would have to pay a toll tax every 10 miles. Between Nagapattinam and Palakkad fort, a distance of 398 kilometers, there were more than 30 such toll booths.
The renter caused localized famine by hoarding grain, prohibiting its sale and selling at exorbitant prices during scarcity.
In case the people resisted his tyranny, he could call upon military back-up.
Now who does this sound familiar to…? The renter whom the Gazetteer decries is a carbon copy of the British revenue officials!
In 1781 CE, the East India Company got the right to collect revenue from the Nawab. The Company became for all practical purposes the ruler of the region (H.R. Pate 1917). The Company appointed revenue collectors known as Receivers and this species was above the Nawabs renter in the food chain. In 1783, the renters were dismissed, and the receiver took full control of the district. This on-off situation continued till 1790, when the renters were finally cut out from the chain.
The British created a system of bureaucracy whose sole purpose was to extract revenue from the land. Except for a few exceptions, every British collector “maximized” revenue collection, to the extent that even lands which were not cultivated were subject to land tax. For example, if a farmer had 10 acres of fertile land but cultivated only 5 acres and left the remaining area fallow, the British would tax the entire 10 acres at the same tax rate.
Even during the early years of British occupation, till the 1830’s, existing landlords acted as a buffer between the merciless revenue demands and the smaller farmers. However, by 1890’s this class was destroyed by British policies and the stereotype blood-sucking zamindar from Hindi movies had taken their place. This is illustrated by an incident recounted by a Tehsildar, Chentsal Rao in Raghavaiyangar’s book (Raghavaiyangar 1893):
“My grandfather once told me that when he was a tahsildar, the collector having on one occasion called upon him to expediate the revenue collection and intimated that if he did not remit at least Rs.50,000 within a week, he would be dismissed. A single ryot paid all money in advance and received it afterwards from the ryots in his taluk. Such men of wealth and influence over the ryots do not now exist.”
The most fundamental difference between the Bharatiya tradition and the British was that they saw themselves as the real owners of the land and everyone else as “tenants” who were free to farm so long as they could pay the “rent” in the form of land revenue (Mustafa 2007). In that era, the standard term to refer to the British occupation was the “Government”. The British did not recognize the hereditary rights in existence as their only aim was to maximize the revenue collection.
From 1801 till the early 1900’s, the British experimented with different systems to try and maximize the land revenue. Each innovation had its own disastrous effect on the farmers and a land of plenty was reduced to bare subsistence. Mustafa has correctly pointed out that, “from 1801, the demand for land revenue was more than what the renter or tenant could bear. Revenue had to be collected forcibly in many places in Chittoor as well as other parts of the Madras Presidency” (Mustafa 2007).
Things were made worse by the destruction of Indian industry and trades by the British Occupation. The only survival avenue left for millions of people was agriculture and this led to a fragmentation of farms and micro farm sizes (less than an acre).
By the time the British ran from Bharat there were three mixed-up systems of revenue collection in Madras Presidency: a) Ryotwari; b) Zamindari; and c) Inamdari (Mustafa 2007). By 1947 CE, agricultural productivity had gone through the floor, millions had been wiped out in famines, the countryside stripped bare, traditional industries annihilated, and millions of acres rendered infertile.
The graphs and explanation are for the ryotwari lands which contributed between 80-85% of the total land revenue. As the Zamindari and Inam lands were taxed under different parameters these have been excluded from the write-up.
I have followed Dharampal’s system of converting the land revenue from rupees per acre to kilos per acre. This gives a better idea of the actual burden on the farmers. I have discussed this approach in detail in the next section.
Brutalization of Indians was institutionalized by the British occupation to the extent that even third-rate government peons held powers of life and death over the farmers. By the mid-19th century, the British officers had “outsourced” torture to their Indian quislings. While the white occupation kept its snout in the trough by murders, rapes, slavery, and random brutalization, this was rarely recorded as the British were quite particular about keeping-up their image clean amongst their peer Anglo-Saxons. What Indians thought did not matter as they were “savages”.
Another fundamental, though rarely mentioned aspect, is that in a criminal case, only a white person could testify against another white man. You don’t need to be a genius to figure out the chances of that happening. Thus over 90% of the rapes, custodial murders, and inhuman torture went undocumented but there were some exceptions such as the Madras Torture Commission report of 1855 CE.
The report was the result of a Commission set up under orders from the Court of Directors of the East India Company in London to address the growing outcry in Britain against widespread torture practiced by the revenue and police departments (Bhuwania 2008). It was the revenue department which was responsible for the majority of cases of torture while the police department was pretty much a sideshow. The number of false confessions made by people under torture can be seen from the fact that during 1853-55, around 1696 people retracted their confession before the sessions court and around 53% were released by the court (Presidency 1855).
The cases brought by the victims against the low-level Indian enforcers were usually dismissed by the Collectors and Courts. This even though 90% of cases were never reported as people were cowed into submission by the British Occupation.
It is a flawed document and like most documents from the British Occupation, it will be a mistake to take it at its face value. The fundamental flaw lies in its mission statement which absolves Europeans (this was the term used to describe White people whether English, Irish, Scottish or from mainland Europe) and fixes all blame on the Indian underlings. This was really a whitewash commission, whose main aim was to absolve Europeans from the blame and pin the guilt on the Indian minions.
I have selected a few cases from the report which are from Tirunelveli as they are relevant to this monograph. As I progress through different districts of Tamil Nadu, I will present two instances of torture for the relevant district.
Case 1 from 1855: Vanamurthi Nada Pillai was a farmer from Tirunelveli district whose crops failed in 1854 due to poor rainfall. Due to this he was unable to meet the land revenue demands and applied for remission. However, the tahsildar, Appavoo Moodelly[1] proceeded to torture them in the following manner:
“I and others were placed in charge of peons who used to take us out in the sun; sometimes to a rock on the north of our town, and at other times to the sand near the hill. There we were made to stoop and stones were put on our backs, and (we) were kept in the burning sand. After 8 o’clock at night we were let go to our rice.” (Presidency 1855)
This torture continued for 3 months despite Vanamurthi petitioning the Collector, who simply refused to accept them. He then approached the sessions court which sent the petitions to the Collector, where it was stonewalled. Instead, the revenue officers served a notice of arrears on Vanamurthi, and his property was sold off to recover the dues. The women of the household were molested, and a painful torture device called a “kittee” (a thumbscrew, which seems to be a clamp which creates very high pressure on the body part) was applied to their breasts during torture.
Case 2 from 1854: Kailasa Pillai of Ambasamudram was tortured by the tahsildar Appa Moodelly (might be Appa Mudaliar, perhaps same tahsildar from Vanamurthi’s case). Kailasa Pillai had leased lands to a peon called Teroovian Pillai (?) from another tahsil, Suvaranamadavi, on the condition that the land revenue portion (known as the Circar Kist) and Svami-bhogam (the owners share) was paid yearly. In the third year Terrovian Pillai defaulted and paid only a portion of the land revenue. After trying to recover dues, Kailasa leased the land to another tenant, Nullakunoo.
In a grotesque twist, the amount, which was due by Terrovian Pillai, was demanded by the tahsildar for Suvaranamadavi, Appa Mudaliar, from Kailasa as he was the owner of the land. Appa Mudaliar got the tahsildar for Kailasa’s area to detain him till the dues were paid. Additionally, the peons of the tahsildar of Suvarnamadavi imprisoned and beat up the new tenant, Nullakunoo, set fire to his house, and molested his women. Nullakunoo suffered a loss of Rs.150, which in today’s rate equals to 5 lakh rupees. Kailasa sent his minor son to Appa Mudaliar to sort the matter out and when that didn’t work, he approached Appa Mudaliar. On this occasion Kailasa was subjected to:
“(The tahsildars peons) Abused me disgracefully and beat me in front of his katcheri (office), exposing me to the sunshine in a stooping posture. The tahsildar ordered his peons to take me to the public street, where the temple chariot (ratha) use to pass, and there to beat me and abuse me disgracefully, exposing me to the sunshine and laughter of the mob throughout the whole day in a stooping posture with a heavy rock on my back.” (Presidency 1855)
Figure 3 Land revenue per acre in rupees, TIrunelveli district 1801-1947 CE
Looking at the graph (Figure 3) for land revenue per acre in rupees, it doesn’t look like there was a lot of burden on the farmer. For land revenue based on estimated cultivated area, the average revenue per acre in rupees till 1947-48 comes to Rs 2.80. Similarly, the average revenue per acre based on actual cultivated area comes to Rs 3.18. Looking at this data, there is a solitary peak of Rs.5.32 in 1859-60 CE, other than that it mostly fluctuates between 2-3 rupees per acre.
Dharampal in his notes (Dharampal 2011) has pointed out the correct way of understanding the magnitude of the land revenue paid to the British Occupation. And that method is to convert the rupees per acre into the equivalent quantity of grain i.e., paddy in this case. This quantity will give a rough idea of why the farmers were bled to the bone in the British occupation.
Figure 4 Estimated land revenue from the Ryotwari system converted into kilos of paddy.
Looking at Figure 4, for the first 60 years of British occupation (1801-1860 CE) the farmer was converting anywhere between 30-53% of his produce into cash to pay the British revenue farmers. Thus, if we assume the average produce to be 547 kilos per acre, the farmer had to forgo around 273 kilos as revenue to the British occupation. This is a very significant amount and when other costs such as cost of cultivation, rent to the landlord (if the farmer did not own the land), wastage, food for his survival etc. are taken out, there is hardly anything left. For the average farmer the question of profit simply did not arise, there was hardly any food left to tide over droughts and famines. This is the key reason that people in villages died in their millions during 150 years of British occupation.
I have assumed the average produce per acre over 150 years as 547 kilos which comes to around 1205 lbs. This is based on Dharampal’s estimate. The British assumptions of yield were unrealistically high, and the tax was set to these hypothetical figures. For example, in Ajmer, as late as the early 1900’s, the assumed yield was on average 23% more than the actual yield (M.S.Jain 1994). The yield per acre itself is a problematic thing as every piece of land will have a different yield depending on a host of factors. There are different figures for the yield per acre, I have discussed this problem in brief in the Appendix.
The British experimented with different revenue systems as their aim was to maximize revenue collection. There were some minor changes after 1860 CE, partly because of the war of 1857 CE, but by this time 2-3 generations of Indians had been stripped to the bone and millions of acres had become wasteland.
While the land tax was very high it is only part of the full picture. For a non-agricultural person like me it was quite difficult to understand the disastrous long-term effect of the land tax till I understood the costs of cultivation.
Based on inputs from my sister Dr. Archana Kale, who is an agricultural scientist, and the cost of cultivation reports for different years brought out by the Government of India, I have pegged the cost of cultivation at a conservative 70% (Directorate of Economics and Statistics 2007), (Directorate of Economics & Statistics 2017). Going by the 2021-22 statistics, the cost of cultivation comes to around 67%, while that for 2022-23 is 76% (Welfare 2021). In the older reports, especially from the late 1990’s, the cost comes to more than 80%. My assumption is close to the cost of cultivation in the 19th century, and this is attested by La Touches’ underestimated figure of 67% for Ajmer region in 1870’s (M.S.Jain 1994).
What does the cost of cultivation involve? The agricultural statistics reports typically divide the costs into 14 main categories, called cost concepts (Directorate of Economics and Statistics 2007):
Value of hired human labor
Value of hired bullock labor
Value of owned bullock labor
Value of owned machinery labor
Hired machinery charges
Value of seed (both farm produced and purchases)
Value of insecticides and pesticides
Value of manure (owned and purchased)
Value of fertilizer
Depreciation on implements and farm buildings
Irrigation charges
Land revenue, cesses and other taxes
Interest on working capital
Miscellaneous expenses
A few of these cost concepts, such as insecticides or machinery, will be inapplicable to the 19th century and the early 20th century context. However, most of the remaining cost headers are the same as they were in 1801 or 1947 CE. Fertilizers (organic or chemical), seeds, labor, animal power are constant across the time continuum. From where we stand in the 21st century, it would be very difficult to get a reliable estimate of the cost of cultivation over 120 years ago, the best we can do is to form an approximation based on current data.
In the early years of British occupation, no allowance was made for the farmers cost of cultivation or his profit. It was only after the 1850’s when decades of distress destroyed the farmers financial capacity that small deductions, usually in the range of 15-20%, were made by the British (Raghavaiyangar 1893). To say this was inadequate is an understatement. Raghavaiyangar’s correctly points out that:
“Moreover, the settlement calculations do not, ostensibly at all events, make allowances for the liability of the ryot to pay a fixed cash assessment in all seasons whether the crop he reaps is abundant, or so scanty as to be hardly sufficient for his subsistence. It is well known that poor ryots who borrow grain from sowkars or the richer ryots in the cultivation season have to repay at the harvest, i.e., in 6 or 8 months, the quantity borrowed together with an additional amount varying from 25 to 50 per cent. When the crop fails and payment has to be postponed to the next harvest the additional quantity payable is, of course, proportionately increased.” (Raghavaiyangar 1893)
In the following sections, I have divided the 147-year period from 1801 to 1947 CE into different blocks of years based on the type of revenue system implemented by the British. The key revenue systems were:
The Amani system (1801-1809 CE)
The Decennial Lease system (1809-1821 CE)
The Olungu System (1821-1859 CE)
Puckle Durai’s Settlement (1859-1905 CE)
The Final Phase (1905-1947 CE)
Before we go into the details of the different British experiments with our money, we need to understand how land was classified for revenue purposes. In practical terms, land was divided into 2 categories for purposes of land revenue:
Wet land: This was land which had easy access to good sources of water such as rivers, streams, tanks, lakes etc. This was the most fertile land and farmers sowed anywhere between 2-4 crops a year. For Indian rulers, including the so-called Nawabs, wet land was taxed by dividing the produce between the Sarkar and the farmers (H.R. Pate 1917). This practice lasted through the term of the Nawabs rule from 1739 to 1800.
Dry Land: Any land which did not have access to plentiful water was classed as dry land. This was a wide range going from the most barren desert like land to somewhat fertile land with access to a well or similar source. Under the Nawab, dry land was usually discounted from land revenue and instead considered the village property on payment of a fixed amount to the rulers (Raghavaiyangar 1893) (H.R. Pate 1917). The villagers then had a sophisticated system where shares were allotted in the lands to individual farmers. Dry lands were divided into four classes based on their fertility: a) Karisal;b) Veppal; c) Pottal; and d) Sevval, this last category being barren land.
Now that we have the basics out of the way, without further ado let’s take a trip down memory lane.
The first British experiment in 1801 CE in revenue extortion was a hotch-potch of the Nawab’s revenue system and the British Collector Lushington’s ideas. This was the amani system. As usual dry lands and wetlands were assessed separately. For wetlands, Lushington surveyed the district and made a rough estimate of the revenue payable by the farmers. For dry lands, he used the existing classification and in 1804 CE added a fifth category to the existing four categories. The farmers from one village were tasked with classifying the lands of their neighboring village into various tarams (i.e., categories). The gamut of revenue rates started at Rs.2-5-0 per acre for wetlands and ended at 10 Annas for the most infertile dry lands. On top of this were piled several taxes such as moturpha, nilavari, deshkaval, and village taxes.
Lushington, increased the revenue due by the palegar villages by 117% (H.R. Pate 1917). Another round of settlement was conducted in 1802 and 11 palaiyams were handed back to palegars, till finally by 1803 CE twenty-five remaining palegars were converted into the British Zamindar format.
Lushington first surveyed the district and fixed the revenue based on estimated produce. Another practice of the amani system was loans given out by the British to farmers for cultivation. This was taken back with interest when the revenue was collected. The British collected half the revenue in money and the other half in grains which was hoarded at the East India Company’s warehouses, being sold when there was a scarcity of grain on the market. Much like the late unlamented Renter, the Collector unleashed a mob of peons in the district whose job was to ascertain the amount harvested by the farmers. Due to the closeness of the harvesting months, the peons stayed back in the villages till the January harvest (H.R. Pate 1917).
Crops were harvested twice a year, once in September and the second time in January (Stuart 1879). The crops harvested around January/February were known as the pisanam crops and those harvested in September known as the kar crops. The Company’s share of the pisanam crop was around 60% and the farmers had to pay the land tax in cash by June. The British impounded the grain equivalent of tax from the farmers and stored them in guarded warehouses till the farmers were able to pay the tax. This forced farmers to dump grain on the market causing a glut and lowering the market price. The British held onto grains from the kar cultivation and waited till there was a scarcity in the market, at which point they sold for a profit.
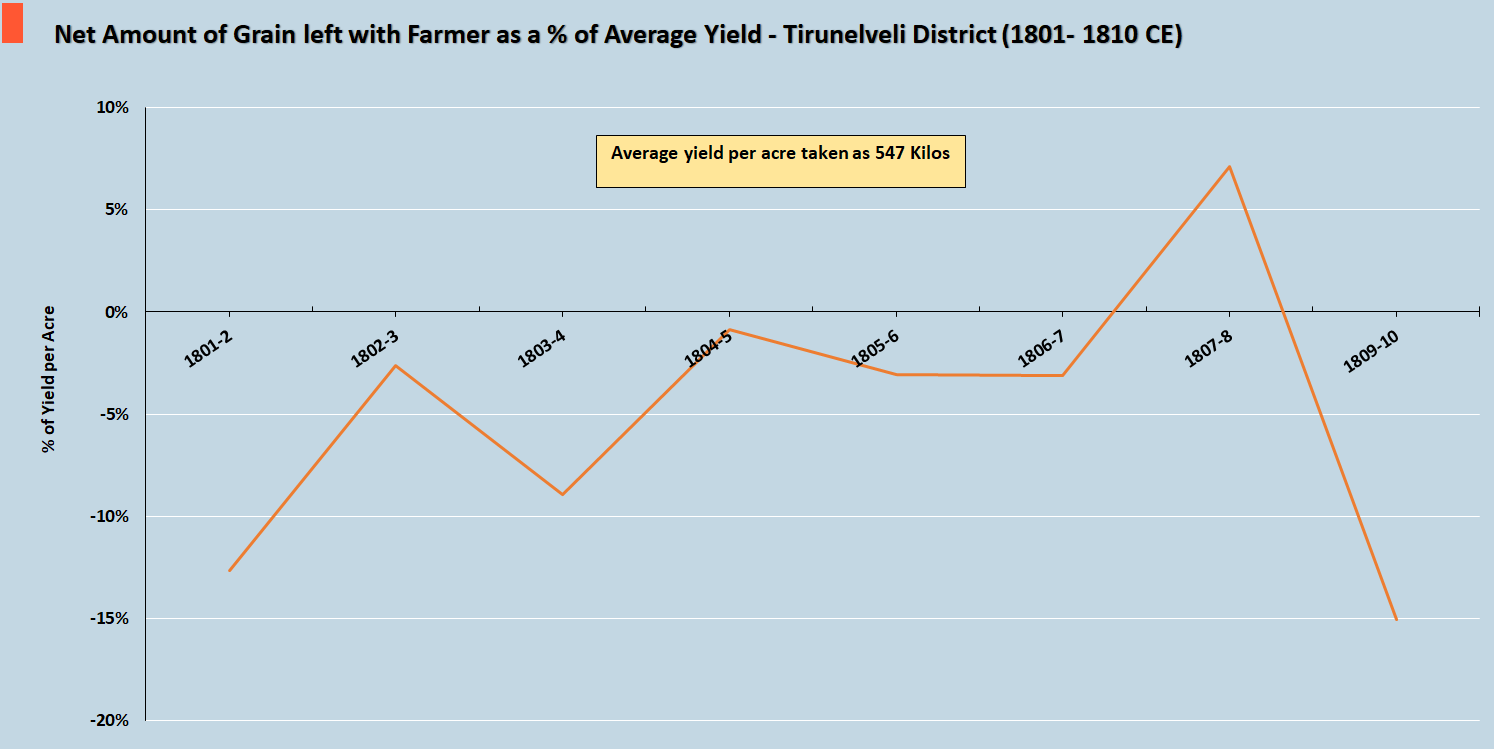
Figure 5 Amount of grain left with the farmer after paying land revenue.
The farmers were hit with a double whammy: the land tax they paid was unrealistically high and the price they got from the market was low. This explains why the farmers began to be perpetually in debt and had to sell their survival reserves to meet the land demand. This is graphically illustrated by Figure 5 where the farmer, except for 1807-1808, had a chronic shortfall of grain to the tune of 15% towards the end of the period.
Figure 6 Net income of farmers per acre 1801-1810
Looking at the data from the perspective of earnings per acre (Figure 6), instead in terms of grain, the farmer was consistently in debt throughout the period. The farmers income only came once out of the red and that was in 1807-08 CE when collections had to be postponed due to severe agricultural distress.
Figure 7 Ryotwari land revenue as percentage of average yield from 1801 to 1810.
Figure 7 shows how much produce per acre that was set aside to pay the land revenue. Except for a brief dip in 1807-08 CE, the land revenue per acre averaged around 35% of total produce, touching a high of 45% in 1809-11.
By 1809, the Amani system was then abandoned in favor of, first a triennial system (every 3 years), and then a decennial (10 year) village lease system. The British being the sole owners of the land, all the village lands were leased out to the farmers for a fixed sum. This fixed sum was known as the rent and was nothing but tax on the land. In April 1809 CE, the rent was fixed on an arbitrary high basis based on the fluctuating figures of the last decade. This caused tremendous distress when the market prices of grain fell as in 1817 CE when the farmers could not pay their taxes. The leading men of villages were forced to cough up a fixed amount as tax on behalf of the village. The farmers then had to distribute the due amount amongst themselves and reimburse the headman.
The British tried to experiment with the ryotwari system in 1817 CE, but this was opposed by villagers who demanded a 25% reduction in the tax assessment as compared to the decennial lease system. The villagers of Vallanad did try to implement ryotwari but quickly dropped it. There seems to have been a violent reaction to the new system as the Mirasdars of Sermadevi had fled to the kingdom of Travancore (in Kerala) and only returned when the collector promised to rebuild their houses. The Board of Directors of EEIC protested against the ryotwari system in the following words:
“ To dissolve this unity of interest and common stock of labor by requiring each to take, instead of the share which he possessed and owned, a defined part of the whole land of the village, would not be very different from dissolving a Joint Stock Company in England, and requiring each proprietor to trade upon his own portion of it in order to be separately taxed.” (Stuart 1879)
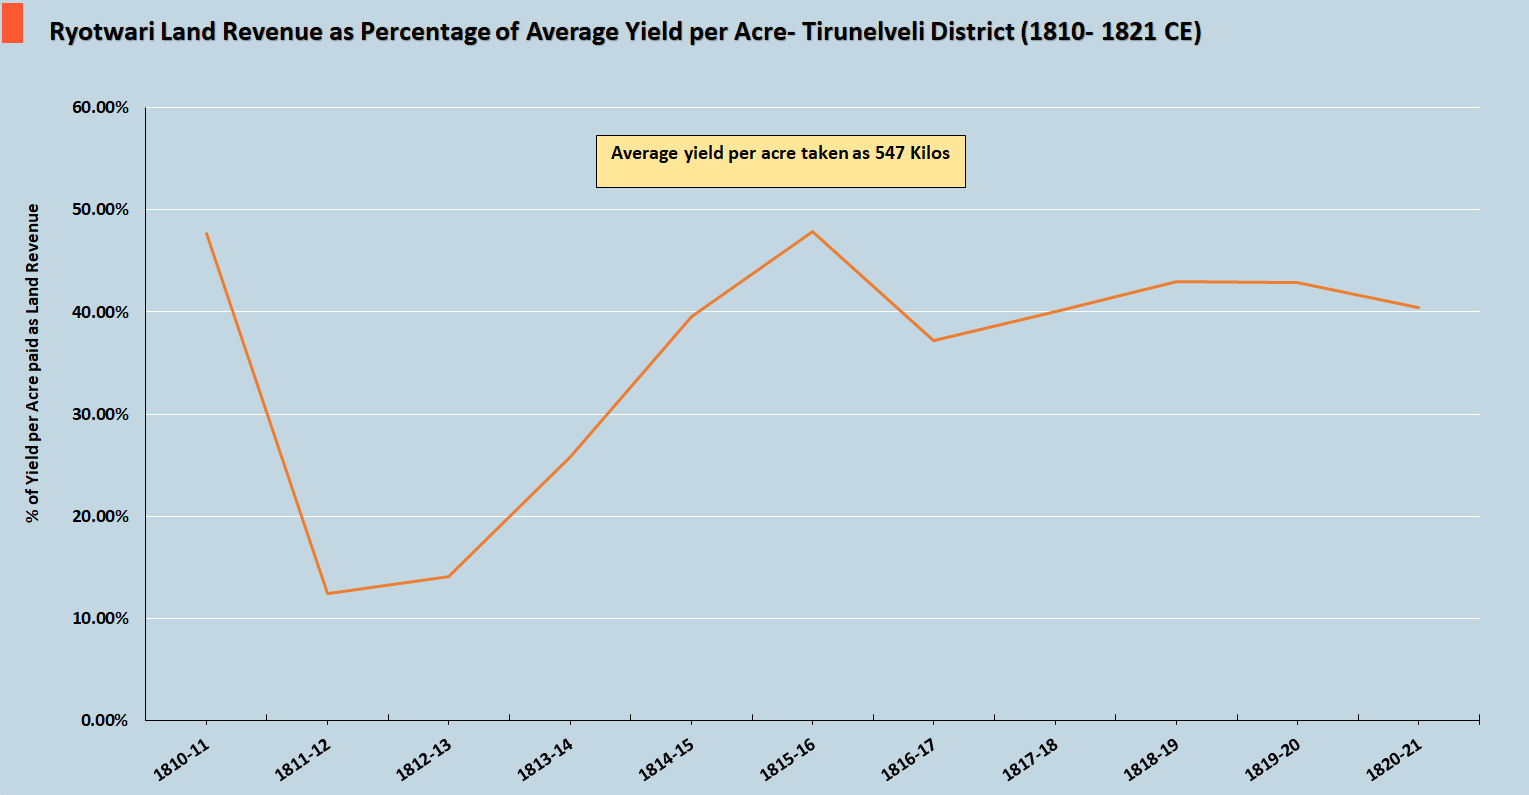
Figure 8 Ryotwari land revenue as percentage of average yield from 1810 to 1821.
Figure 8 shows how much produce per acre that was set aside to pay the land revenue. Except for a brief dip in 1811-12 CE, when the rates were lowered to ease the introduction of the triennial lease system, the land revenue per acre averaged around 39% of total produce, touching a high of 49% in 1815-16 CE. The land revenue of course makes no allowance for the costs of cultivation.
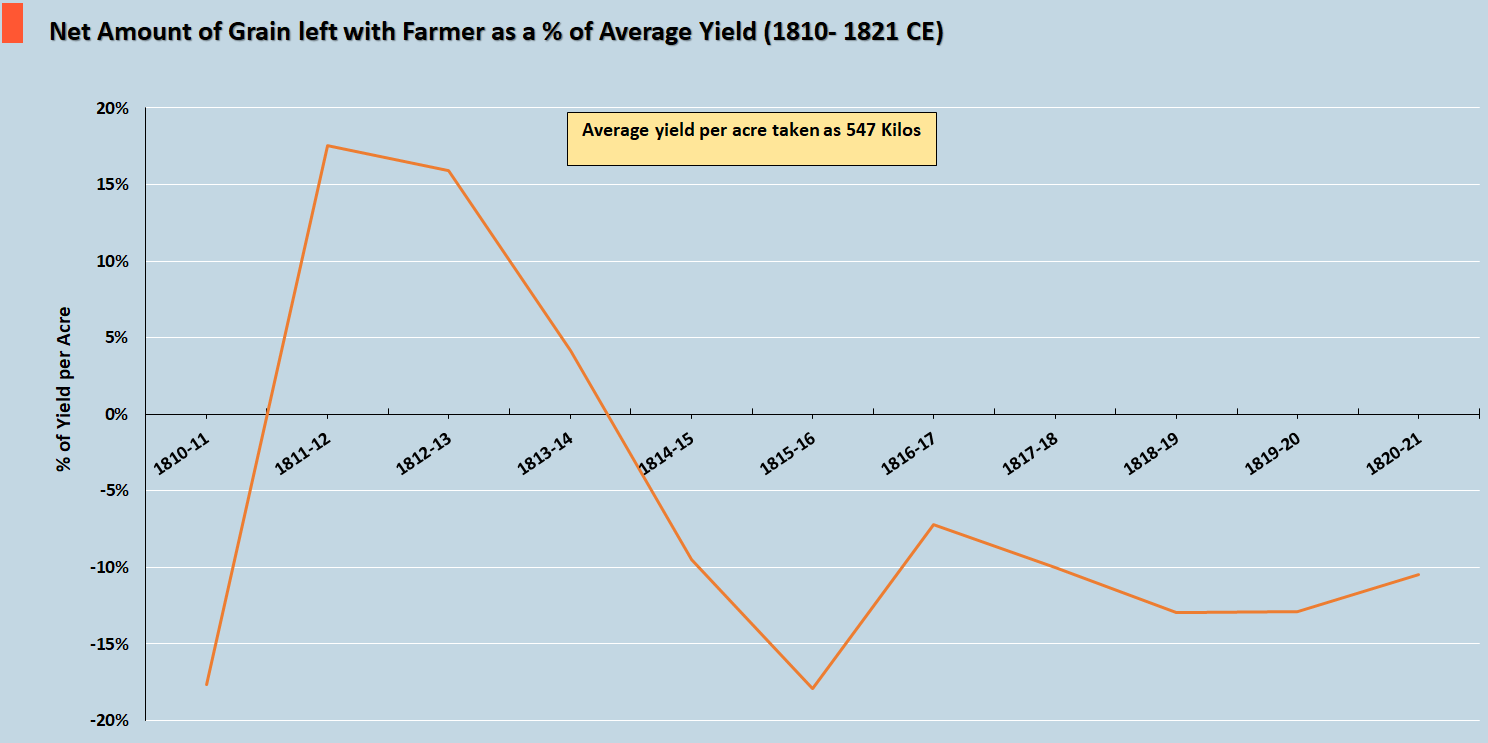
Figure 9 Amount of grain left with the farmer after paying land revenue 1810-1821 CE.
Figure 9 shows that the farmer, except for a brief respite during 1811-1814 CE, had a chronic shortfall of grain to the tune of 10-15% towards the end of the period.
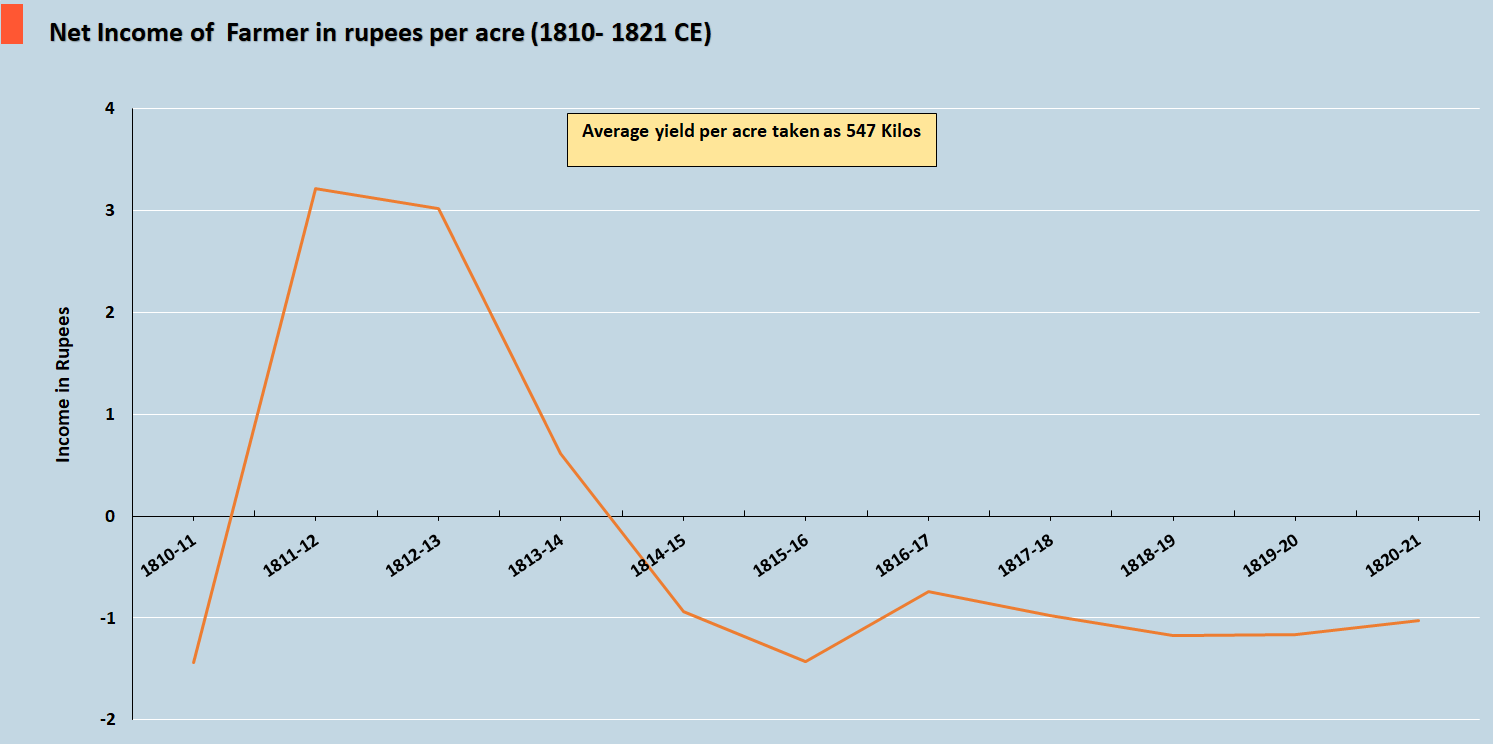
Figure 10 Net income of farmers per acre 1810-1821 CE
Looking at the data from the perspective of earnings per acre (Figure 10), instead in terms of grain, the farmer was consistently in debt throughout the period. The farmers income only came once out of the red and that was in 1810-14 CE when the trailing of the triennial and decennial lease systems led to a relative relaxation in revenue extortion.
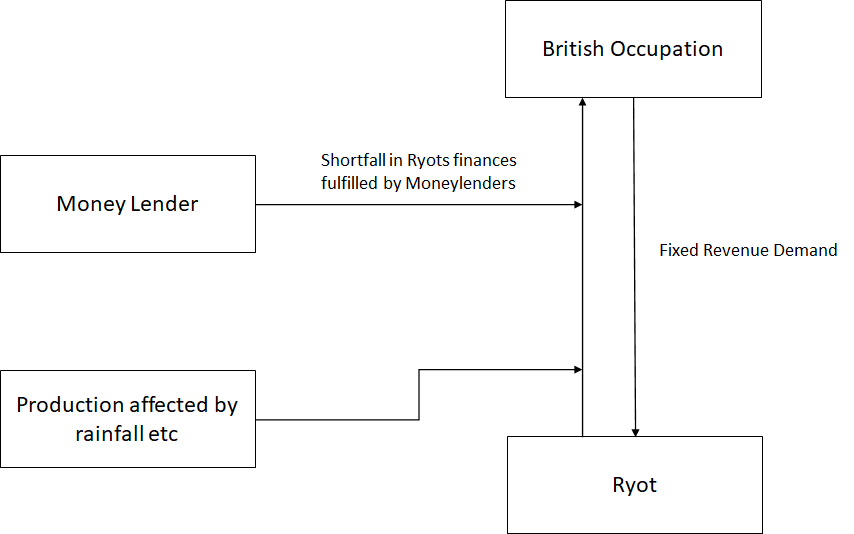
The decennial lease system was discontinued in 1821 CE as a failed experiment. This was replaced by the Olungu system. Figure 11 shows the working of the Olungu system.
Figure 11 The working of the Olungu system of land revenue in Tirunelveli
The system worked as follows:
First a standard market price and the government share of the village crops (known as the melavaram) was fixed. This was arbitrary without any sound basis and in the early years of olungu the standard price was adopted as the average selling price for an unspecified period prior to 1825-26 CE. The melavaram was later on fixed based on assumed output of seven years from 1803-04 to 1810-11 CE, when the amani system was in force. In later years the market price was recalculated every April.
The melavaram was converted into its money equivalent every year taking the standard price as the basis and accounting for any fluctuations in the market price. For example, if the market prices were 11% above the standard price, 1% was added to the standard price.
On the other hand, if the price rise was within 10% or it fell by under 5%, the standard price was used to convert the grain share into money.
If the price fell more than 6% then the standard price was reduced by 1%.
While the system might look appealing on paper, as the land tax would be flexible enough to move up and down with market conditions, the reality was quite different. The reasons for this are not far to seek: the standard price was fixed at an unrealistically high level. If the village did not have access to good water sources, the standard quickly became an albatross around the villagers necks. For villages with wetlands, the entire village was assumed to be equally fertile and assessed at the same rate. At this point in time, during the 1830’s there was no system to classify the lands based on their fertility. Thus, what ended up happening was the existence of over 146 olungu rates in Tirunelveli and with the tax rates being declared in April, the farmers were usually in for a nasty surprise.
Averages, while a useful statistical figure, have little meaning when dealing with diversity in data. Thus, if the most fertile land in the village produced 800 kilos of rice per acre and the worst quality land in the same village produced 400 kilos per acre, the average comes to 600 kilos per acre. This means that the farmer whose plot produces 400 kilos is now paying the tax for an output he will never see in his life. And this is in years when the market price is steady or falling. What happens when the market price shoots up? This rise started from 1843 CE and by 1853 CE had doubled, in 1857 CE shot up by another 40%. Thus, the land tax payable was Rs. 28 lakhs in 1858 CE!
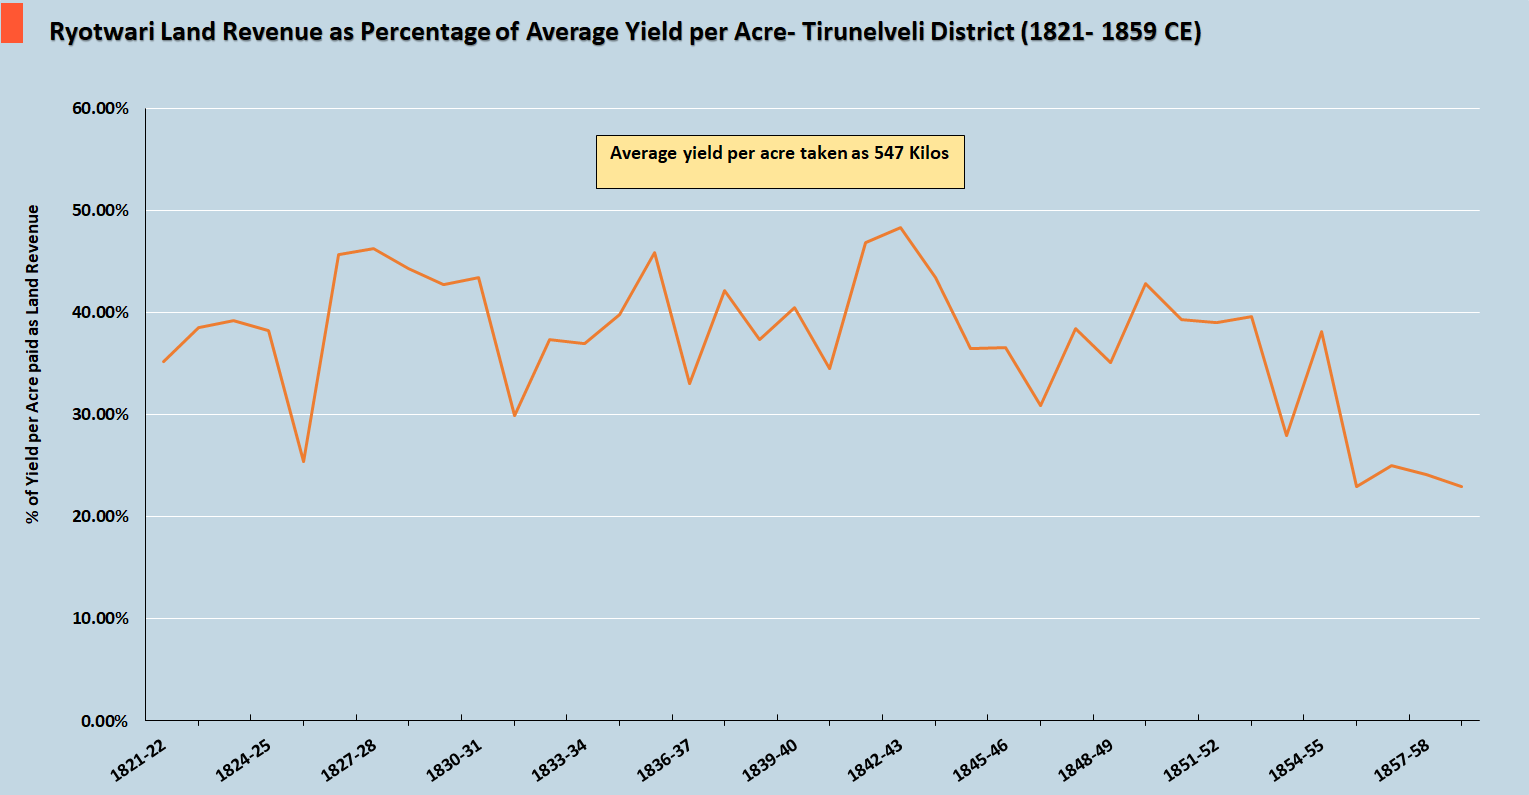
Figure 12 Ryotwari land revenue as percentage of average yield from 1821 to 1859.
Figure 12 shows how much produce per acre that was set aside to pay the land revenue when the Olungu system was in force. The land revenue per acre for the 40-year period averaged around 41% of total produce, touching a high of 52% in 1842-43 CE. The land revenue of course makes no allowance for the costs of cultivation.
Figure 13 Amount of grain left with the farmer after paying land revenue 1821-1859 CE.
Figure 13 shows that the farmer had a shortfall of grain till 1859 CE which was the end of the olungu system. This positive rise was due to a market crash where grain prices dropped by 30% in 1859-60 CE.
“In a place where there are no learned people, even a dull-witted person becomes laudable. In a place where there is no vegetation, even a castor plant passes for a tree.”- Sanskrit proverb (Kashi n.d.).
This Sanskrit subhashita aptly captures Richard Kay Puckle and the 30-year lifetime of his revenue settlement. In 1866 CE, Richard Kay Puckle became the Collector of the district and with that started Puckle Durai’s[2] settlement. Puckle was quite a powerful bureaucrat and seems to have been well connected as he acted as both the Collector and Settlement Officer for Tirunelveli (H.R. Pate 1917).
The period from 1859 to 1864 CE was a time of change as the old olungu system was junked and ryotwari was brought in from 1861 CE onwards. A new system of maintaining two registers, an A register and a B register was started at this time. The B register was a record of the land held by each farmer, this included both cultivated and non-cultivated land. The farmer was taxed based on the total land under his name, whether cultivated or not. The choices before the farmer were simple: pay the tax or let go of the uncultivated land. In a country where Mother Earth is worshipped as Goddess Bhudevi, it is not surprising that most farmers preferred to pay the tax and retain around 250,000 acres of uncultivated land (H.R. Pate 1917). That the British occupiers with their Christian outlook could not fathom this is unsurprising as all Abrahamic faiths are contrary to nature.
The reality was that as usual the British Occupation did not want to spend resources on doing a detailed survey which determined how much land in each farm was actually cultivated (H.R. Pate 1917). It was easier and profitable to simply stick the farmer with a tax bill based on the size of his land. The statistics unsurprisingly showed a jump of 18% in terms of cultivated land and a rise in revenue (H.R. Pate 1917).
Displaying the usual Abrahamic antipathy towards Brahmins and the zeal to save money for the British occupation, Puckle promptly abolished an ancient tax exemption given to Brahmins known as chaturbhagam. From the gazetteers observation that, “Mr. Puckle adopted the policy of enlisting the cooperation of the people in executing at their own cost works of public utility”, it is obvious that he used forced labor to repair waterworks (H.R. Pate 1917).
Puckle divided the district into four divisions based on its geography (H.R. Pate 1917). These were : a) Nirarambam, lands watered by the Tamraparani river; b) Kadarambam– the part not watered by any river; c) Palmyra forest- this was a coastal belt of mostly barren sand dunes with palmyra trees; and d) The belt of black cotton soil land.
He revised the benchmark commutation rate by taking an average of market prices for the decades from 1844-1863 CE. Another innovation was to divide the soil into five classes based on their fertility:
Best
Good
Ordinary
Inferior
Worst
These soil types were then further divided into 7 classes of wet and dry soils known as tarams. Each taram had soils of different types but with the same productivity. For example, black soil with good productivity was classed as “Good Black Loam” and considered comparable to “Best Red Loam (red soil)”. If this seems complicated to us, even the revenue officers had no clue how to implement them. Like all other things in British occupied India, this ended up being arbitrarily applied on the ground. Each taram had two sets of rates, one for a single crop and one for the second crop.
The 14 tarams were not the end of the story, for a further two tarams were added to the dry soils on the assumption that since they had access to irrigation facilities at some point in time, they were considered permanently improved!
There were obvious problems with this approach considering that fact that a village could have good sources of irrigation but very poor-quality soil. Conversely a village with good quality soil could be dependent on the elements for water. As the gazetteer points out the revenue officials had to manipulate the classification to get an applicable rate (H.R. Pate 1917). Ironically, this occasionally worked in the villagers favor if they were lucky to be next to a new canal system. In this case they would be assessed for tax based on the pre-existing water source like ancient man-made reservoirs, known as tanks.
For revenue assessment the villages were broken down into blocks of 10-50 acres and categorized into a taram depending on the soil type and type of irrigation. To address the vexatious question of yield per acre, Puckle undertook experiments and fixed the average yield per acre as 1200 Madras Measures. This works out to 1377 kilos, depending on which conversion of the Madras measure is used, a topic of debate in itself. But this was only for the wetlands, for dry lands the yield per acre was assumed arbitrarily.
The next stage was to fix the revenue payable by each class of soil based on the average market value of paddy from 1844 to 1863 CE. A small deduction of 15% was made to cover the cost of selling the produce in the market and rate of Rs.3.9 per kottai (160 kilos of paddy) was finalized. The cost of cultivation was assumed as Rs.15.4.0 per acre of the most fertile land (the first taram) and reduced by Rs.1 for land classes in order of decreasing fertility. This subtracted from the value of produce gave the “earnings” of the farmer and was further halved and a 5% deduction applied for uncultivatable areas of the field. This long and convoluted calculation finally resulted in the land tax payable by the farmer!
Thus, the land revenue, in monetary terms for each acre was obtained by:
Step 1: (Average yield per acre) X (Average market rate) = Value of produce
Step 2: (Value of Produce per acre – Cost of cultivation per care)/2 = Residual Earnings
Step 3: Residual Earnings – (Residual earnings * .05) = Land Revenue payable by farmer
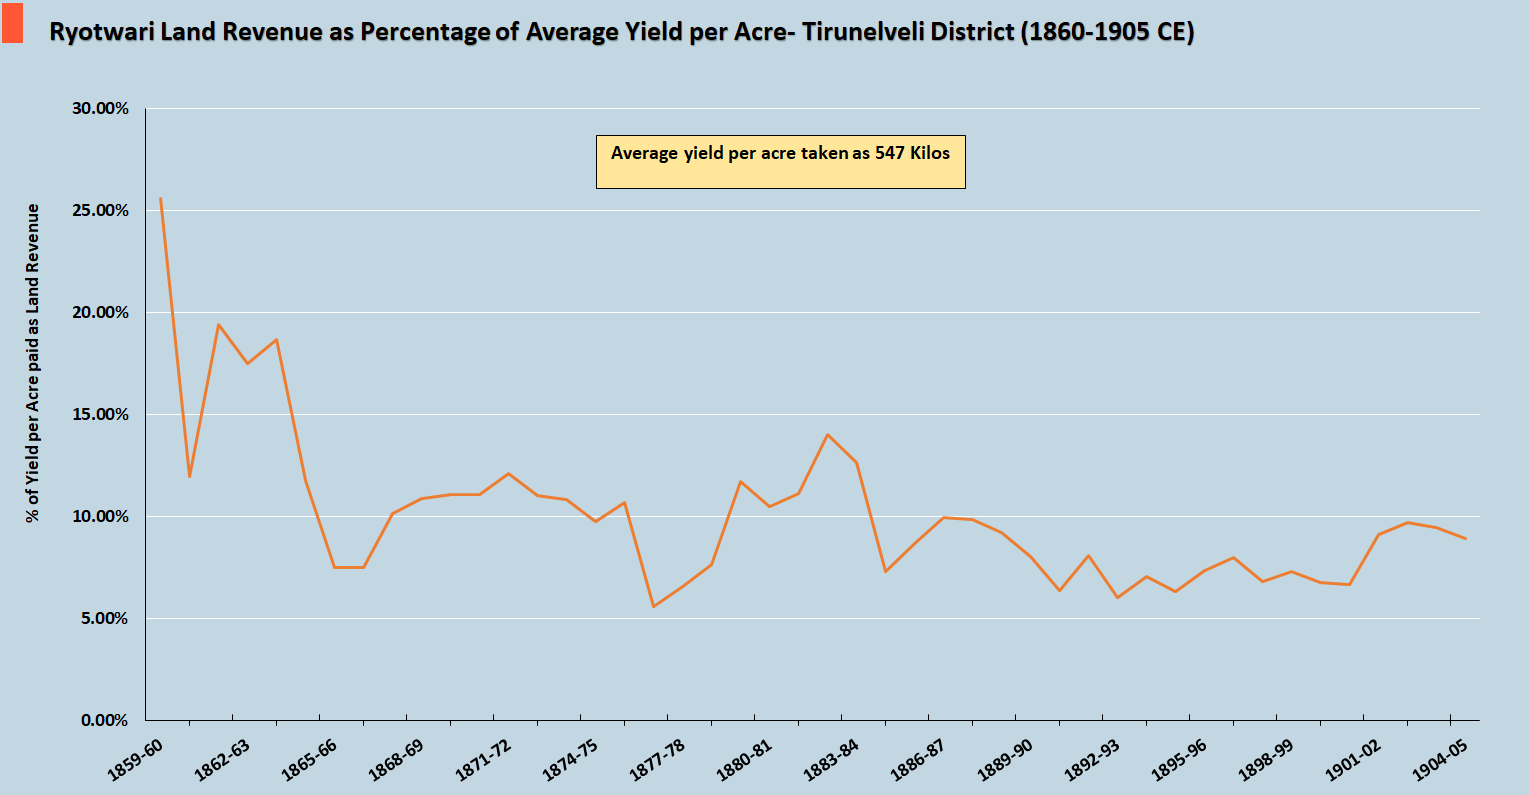
Now that we understand the mechanics of Puckle’s land revenue innovations, let’s look at the statistics for the 30 year of Puckle Durai’s settlement. Figure 14 shows how much produce per acre that was set aside to pay the land revenue when Puckle’s settlement was in force. The land revenue per acre for the 40-year period averaged around 41% of total produce, touching a high of 52% in 1842-43 CE. The land revenue of course makes no allowance for the costs of cultivation.
Figure 14 Ryotwari land revenue as percentage of average yield from 1860 to 1905 CE.
Figure 14 shows how much produce per acre that was set aside to pay the land revenue when Puckle’s settlement was in force. The land revenue per acre for the 35-year period averaged around 20% of total produce, gradually coming down from a high of 25% in the transition years of the early 1860’s.
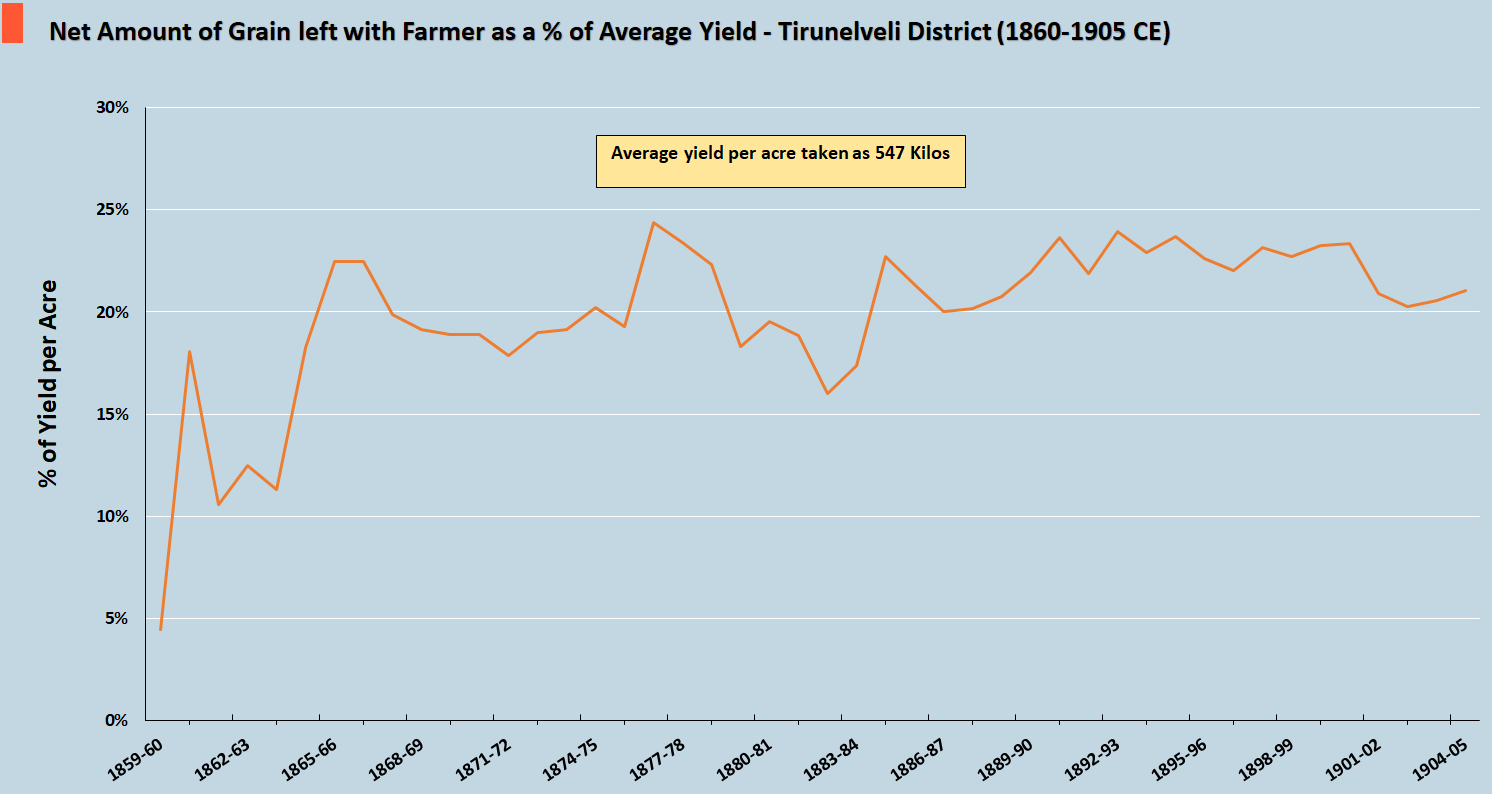
Figure 15 Amount of grain left with the farmer after paying land revenue 1860-1905 CE.
Figure 15 shows that the farmer’s shortfall of grain decreasing, and he seems to have a little surplus from 1865 CE onwards.
(Please Note: This section is a work in progress as the latest document regarding revenue in my possession is the 1917 gazetteer edition. The statistics are all in order as I was able to glean them from different statistical reports, but the description of how the settlement functioned will need to be updated for the period from 1915 to 1947)
As Puckle’s revenue regime was fixed at a period of 30 years, at the dawn of the 20th century, a new survey was conducted to update the revenue rates for the next 30 years. The land under cultivation had increased as more and more barren land was being cultivated at subsistence level agriculture by desperate people. To generate income farmers switched from essential foodgrains such as cumbu (pearl millet or bajra) to cotton which is a very demanding resource intensive crop (H.R. Pate 1917). Using the excuse that prices of foodgrains had gone up by 43% in the thirty-year period from 1865 CE to 1905 CE, the tax was increased by 12.5% for wet lands.
Puckle’s system of classification by type of soil and water-source was revamped a bit in this settlement. The water-sources were reclassified based on whether it was a canal, a water tank, or well (H.R. Pate 1917). This closed the “loophole” of villages getting away with paying less tax for water. The rates for the single and the double crop were reduced as well. As Puckle’s settlement had arbitrarily fixed the revenue rates for dry land, the new settlement applied a 12.5% increase similar to wet lands. Due to these increases the British occupations land revenue demand rose from Rs.22,65,000 to Rs.25,56,000 in 1910 CE.
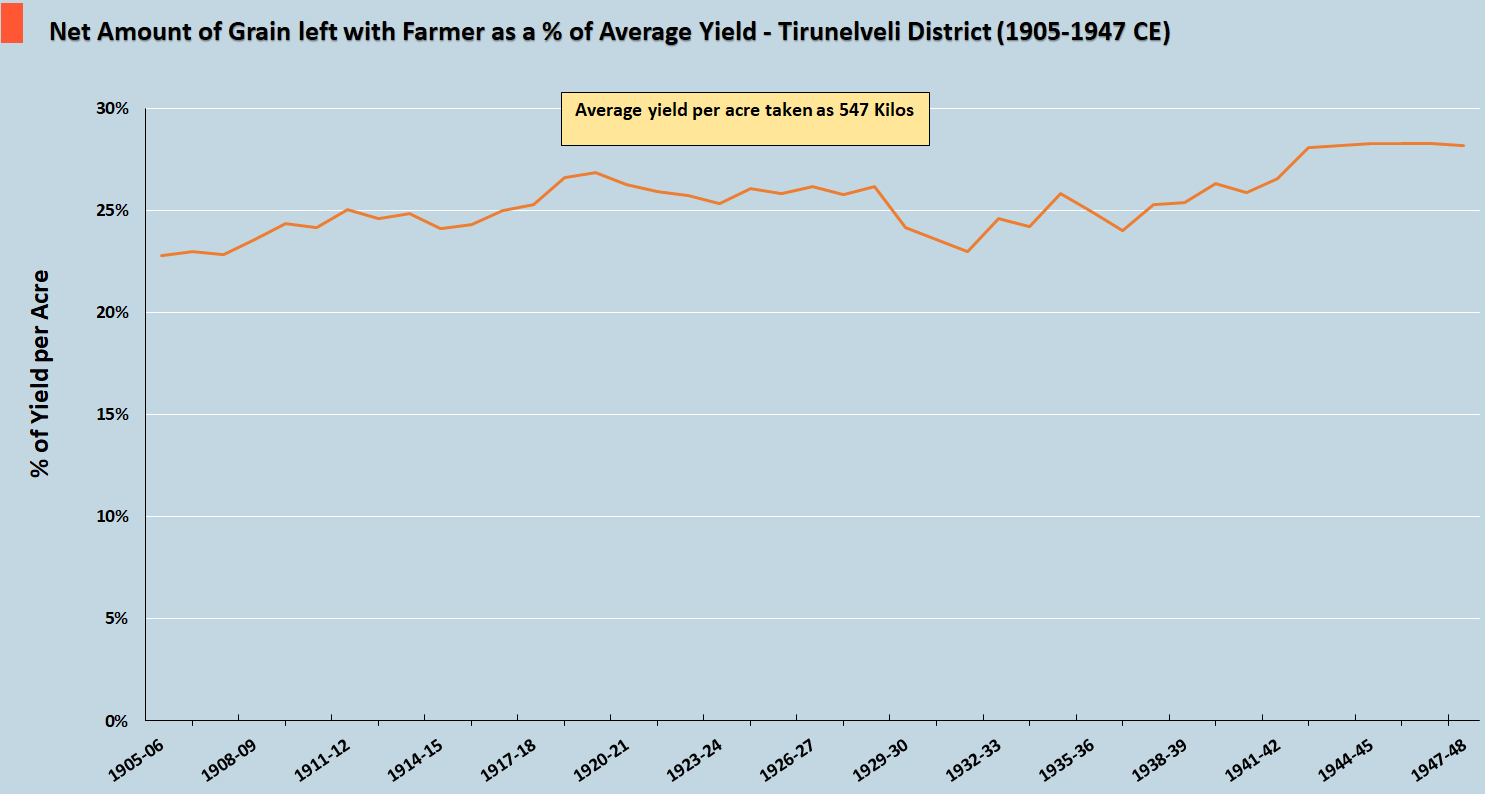
Figure 16 Ryotwari land revenue as percentage of average yield from 1905 to 1947 CE.
Figure 16 shows how much produce per acre that was set aside to pay the land revenue once the settlement was implemented between 1905-1910 CE. This period covers the two world wars and the depression of the 1930’s which sent commodity prices on a rollercoaster ride. The land revenue per acre for the 35-year period averaged around 5-6% of total produce. It needs to be kept in mind that by this time Tirunelveli had been in British occupation for close to 150 years and the land and resources were completely depleted.
Figure 17 Amount of grain left with the farmer after paying land revenue 1905-1947 CE.
Figure 17 shows that the farmer was able to save some grain for a rainy day.
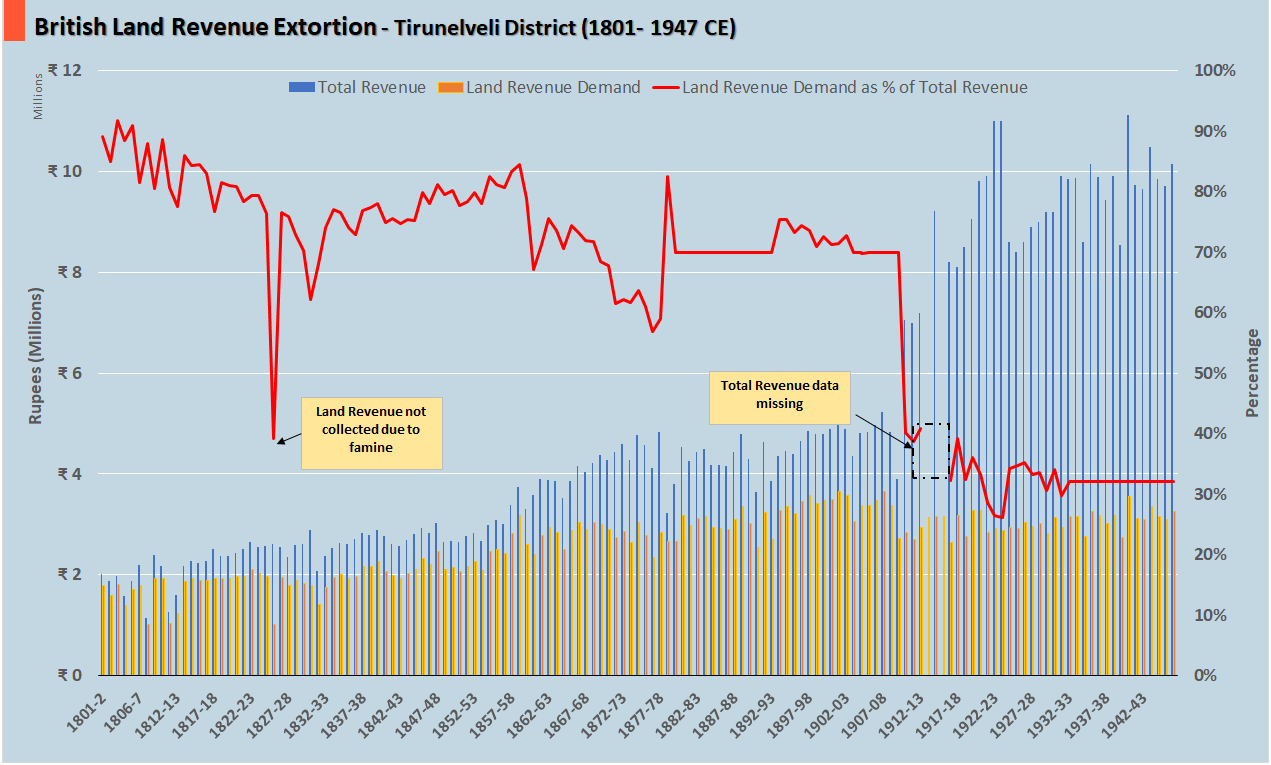
Till this point we have been looking at different time periods and revenue systems. It’s time to put all this together to understand what really went on for 150 years. Figure 18 is a stacked bar chart which shows three key pieces of data:
1) The total revenue for each year, which includes income from sources other than land revenue such as customs, salt, alcohol etc. This is represented by the dark-blue color vertical lines.
2) The land revenue for each year which includes the revenue from ryotwari, inam, and zamindari lands. This is represented by amber-yellow colored vertical lines. To reiterate, ryotwari lands formed 80-85% of the land revenue base.
3) The land revenue as a percentage of total revenue for each year represented by the zig-zag red line.
Figure 18 British land revenue extortion, Tirunelveli district 1801-1947.
I could not locate the data for the 1914-1916 period, and this is the reason for the gap in both the total revenue and the land revenue as a percentage of the total revenue. The interesting observation from the graph is after 1910, land revenue fell from being 70% of the total revenue to somewhere between 40-30%. The reason for this is that other sources such as alcohol, salt, and customs became the main contributors to the revenue pot.
Figure 19 Net amount of grain left with farmer after paying land revenue, Tirunelveli district 1801-1947
Figure 19 shows the net amount of grain the farmer was left with after paying land revenue. Except for brief respites, the first 60 years of British occupation left the farmer in grain deficits in the range of 1-18% and thus perennially in debt with money lenders. While the situation does seem to improve after Puckle Durai took over the district, it’s an illusory picture. A further deduction needs to be made for wastage, fodder etc., which would leave the farmer with 10-15% surplus stock. This is barely sustainable and explains why farmers did not have sufficient buffer stocks to tide over droughts and subsequent famines.
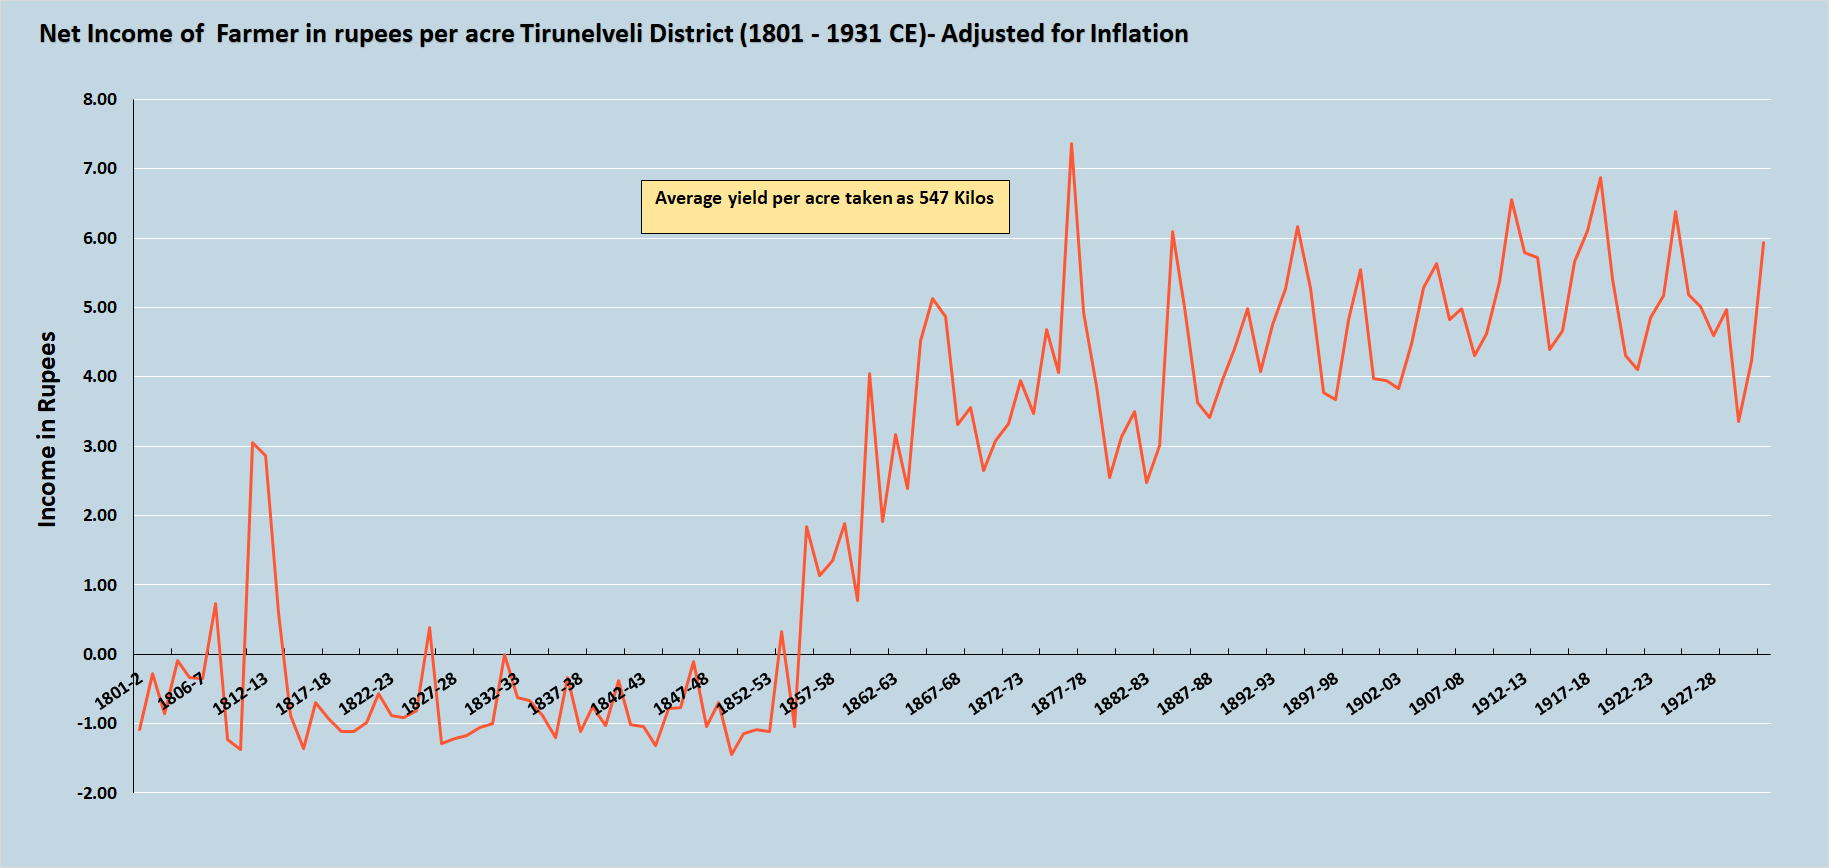
Figure 20 The real income of the farmer from 1801-1931, Tirunelveli District
The last graph in this article, Figure 20, is the most interesting as it gives an approximate idea of the actual earning of the farmer per acre after paying the land revenue. As we have seen in Figure 19, the farmer was in grain deficit for nearly 60 years, and this is mirrored by the negative income (i.e., a loss) for the same period. I have used the index numbers published by the British occupation in India to adjust for inflation and devaluation of the rupee (D. O. Statistics 1933). From 1862 to 1931, which is the last year for the index numbers in the report, it looks like the income is rising and it even touches a high of Rs.7 per acre in the early 1900’s. However, a closer look shows that the income had stagnated between 4-5 rupees per acre.
I had never envisaged doing data analysis of agricultural statistics for any district, let alone Tirunelveli district. While I am a nature lover, agriculture is not something that particularly excites me, I prefer to leave it to my father who is a “farmers son”.
The choice of this topic was accidental. I stumbled across the 150 years’ worth of revenue data for Tirunelveli district in Dharampal’s documents which have been uploaded by Centre for Policy Studies (Dharampal 2011). I was researching the use of forced labor by the British but was intrigued by the dataset.
I make no claims as to the accuracy of my analysis or the underlying statistics. I leave it to the readers to apply their critical thinking and decide on the merits of the article. However, I strongly believe that this article presents a starting point for a district-by-district analysis of the havoc wrought by the British in rural Bharat. Over the years, this can contribute to a more accurate (but still ballpark!) figure of the wealth vacuumed out of Bharat by the British.
While I would prefer to focus on military history, I don’t see myself disentangling from British era records anytime soon. I have already received a suggestion from Prof. Venakata Raghotham, a scholar of Indian history, that I look at Chingleput district in Tamil Nadu next!
The purpose of this short section is to illustrate that statistics by themselves don’t mean anything. And it is a mistake to take the agricultural statistics published during the British occupation at face value. A little bit of analysis shows the data and everything based on it to be a house built on quicksand. The only reliable data is for revenue funneled out of the land.
One of the most dubious aspects of the British era statistics is the figure given for average yield per acre. Unsurprisingly, this was a bone of contention during the British occupation and excites debate amongst the handful of scholars that research this topic in this age.
Why is this figure important? Land revenue was fixed by permanent settlement (which was simply long term, not permanent in the sense of the word) based on the gross yield per acre. For decades, especially from 1801 till 1860’s, this was mostly conjecture of British officials and their native collaborators. Even the land under cultivation was a guestimate as the administration simply wasn’t willing to expend the money involved in hiring many people to survey the districts.
Hence, it often happened that the actual cultivated land was lower than the British estimate. From late 1860’s three things were done :
Resurvey of districts in Madras presidency, in our case Tirunelveli district.
Perform crop-cutting experiments to derive an average yield per acre.
Divide the soil into n-number of categories to work out how much to extort from even barren lands.
The variance in the assumptions for the yield per acre can be seen in the wide range estimates of researchers and the various experiments conducted during the British occupation. Gautam Pingle has nicely summarized pre-British 18th century and stats from British rule in 19th century in his paper (Pingle 2017). Yanasigawa presented average based his research in archival documents which were settlement reports and crop and season reports for various years (Yanasigawa 2011). Both Yanasigawa and Pingle have quoted a third researcher, Sumit Guha’s for the years 1868, 1870. I have not been able to access Guha’s works as of date.
TirunelveliDistrict
Year
18681
18702
18703
18721
1901
1911
1917
1945-49
1955-57
Average produce in Kilos of paddy per acre
1173
802
710
1173
647
747
–
527
679
Table 1 Average yield per acre Tirunelveli district 1868-1957 (Yanasigawa 2011) (Pingle 2017).
Table 1 above is a composite table which combines Yanagisawa’s and Pingle’s data for Tirunelveli district. Yanagisawa had presented another set of statistics ( (Yanasigawa 2011) which give the give a guestimate of normal yields per acre based on adjusting the average yields from the season and crop reports for seasonal factors. This is for rice not unhusked paddy. Yanasigawa used two different conversions to convert paddy into rice for the years . I have converted the weights from pounds (lbs) to kilograms for easier comprehension.
TirunelveliDistrict
Year
1905-09
1911-17
1917-19
1920-24
1925-29
1930-34
1935-39
1940-44
1945-49
1950-52
1953-54
Average produce in Kilos of rice per acre
410
607
534
570
560
543
534
559
481
493
601
Average produce in Kilos of paddy per acre
943
1396
1228
1311
1288
1249
1228
1286
1106
1134
1382
Table 2 Average produce per acre in terms of kilos of rice (Yanasigawa 2011). Rice has been converted to paddy based on Yanagisawa’s conversion of 2.3lbs of paddy for every lb. of rice.
This average is illusory as we need to remember about the diverse soil types: from barren sandy hills to extremely fertile black soil. Pingle’s article has details on experiments conducted by Maclean in Tirunelveli in 1868 on different soil types, based on this average yield of paddy per acre comes to 963 kilos.
Directorate of Economics & Statistics. 2017. Pocket Book of Agricultural Statistics. New Delhi: Ministry of Agriculture & Farmers Welfare.
Directorate of Economics and Statistics. 2007. Cost of Cultivation of Principal Crops in India. Annual Report, New Delhi: Ministry of Agriculture, Government of India.
H.R. Pate, ICS. 1917. Madras District Gazzetteers Tinnevelly Volume 1. Madras: Government Press.
M.S.Jain. 1994. Surplus to subsistance: A critique of British land revenue policy in Rajasthan, 1870-1910 . Delhi: Agam Kala Prakashan.
Mustafa, M. 2007. “The shaping of land revenue policy in Madras Presidency: Revenue experiments—the case of Chittoor District.” The Indian Economic & Social History Review 213-236.
P Arumugam, S.M. Karthik. 2016. “Stochastic Modelling in Yearly Rainfall at Tirunelveli District,Tamil Nadu, India.” International Conference on Processing of Materials, Minerals and Energy. 1852-1858.
Pingle, Gautam. 2017. “Paddy Yields in Pre-industrial South India.” Economic and Political Weekly 36-45.
Presidency, Commissioners for The Investigation of Alleged Cases of Torture in The Madras. 1855. Copy of the Report of the Commission for the Investigation of Alleged Cases of Torture at Madras. Madras: Fort St George Gazette Press.
Raghavaiyangar, S S. 1893. Memorandum on the Progress of Madras Presidency during the Last Forty Years of British Administration. Chennai: Superintendent Government Press.
Statistics, Department Of Commercial Intelligence. 1933. Index Numbers of Indian Prices 1861-1931. Delhi: Manager of publications.
Statistics, Director of. 1963. A STATISTICAL ATLAS OF THE MADRAS STATE REVISED AND RROUGHT UP TO THE END OF FASLI 1360 (1950-51). Chennai (Madras): CONTROLLER OF STATIONERY AND PRINTING,GOVERNMENT OF MADRAS.
Stuart, A.J. 1879. Manual of the Tinnevelly District. Madras: Government Press.
Welfare, Department of Agriculture & Cooperation and Farmers. 2021. Statement Showing Minimum Support Prices – Fixed by Government (Rs.quintal). January 8. Accessed December 17, 2022. https://farmer.gov.in/mspstatements.aspx.
[1] Many of the Bharatiya names are unrecognizable in the British documents as they have been corrupted by atrocious mispronunciation.
[2] For farmers used to bottom of the barrel British officials, Puckle looked like an absolute godsend. The Gazetteer remarks that Puckle was referred to as Puckle Durai (leader/chief in Tamil) by the local people.


Leave a comment